
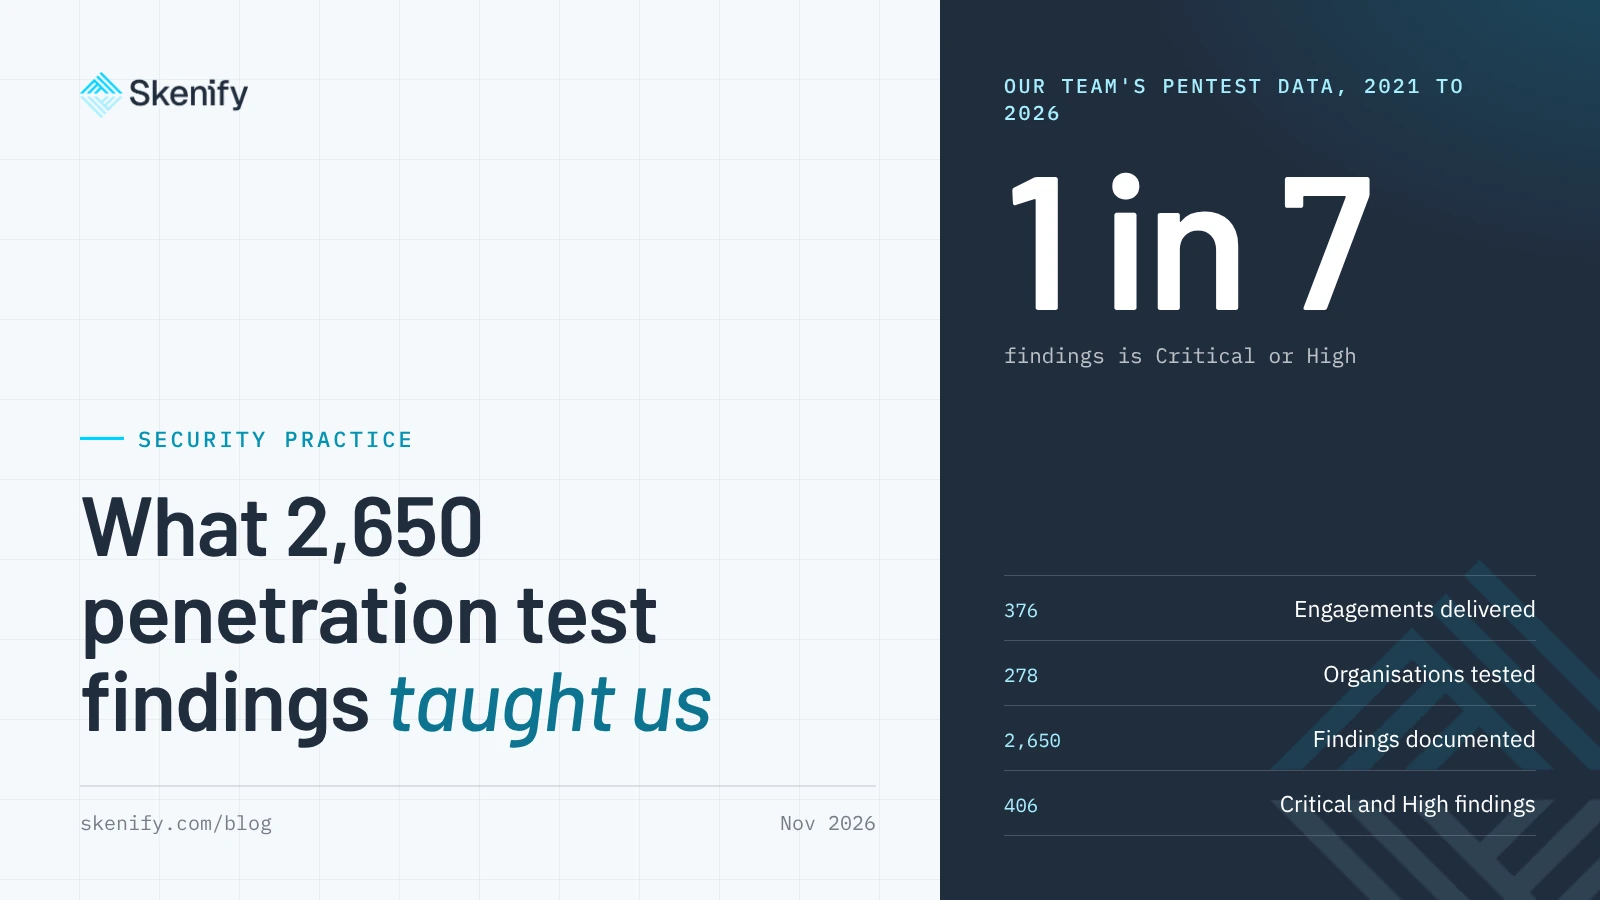
The same team works on Skenify and on the penetration tests we deliver through The Security Company, formerly UN1QUELY. Since 2021 that team has completed 376 engagements for 278 organisations and documented 2,650 findings. I went through the anonymised data to see what it says about where risk sits in a company, and the answer shaped how we built Skenify.
- 376 engagements delivered
- 278 organisations tested
- 2,650 findings documented
- 406 findings rated Critical or High
One finding in seven is serious
Of the 2,650 findings, 92 are Critical and 314 are High. Together that is 406 findings, or 15.3%, which is about one in seven. These are the issues that can put customer data, accounts or availability directly at risk.
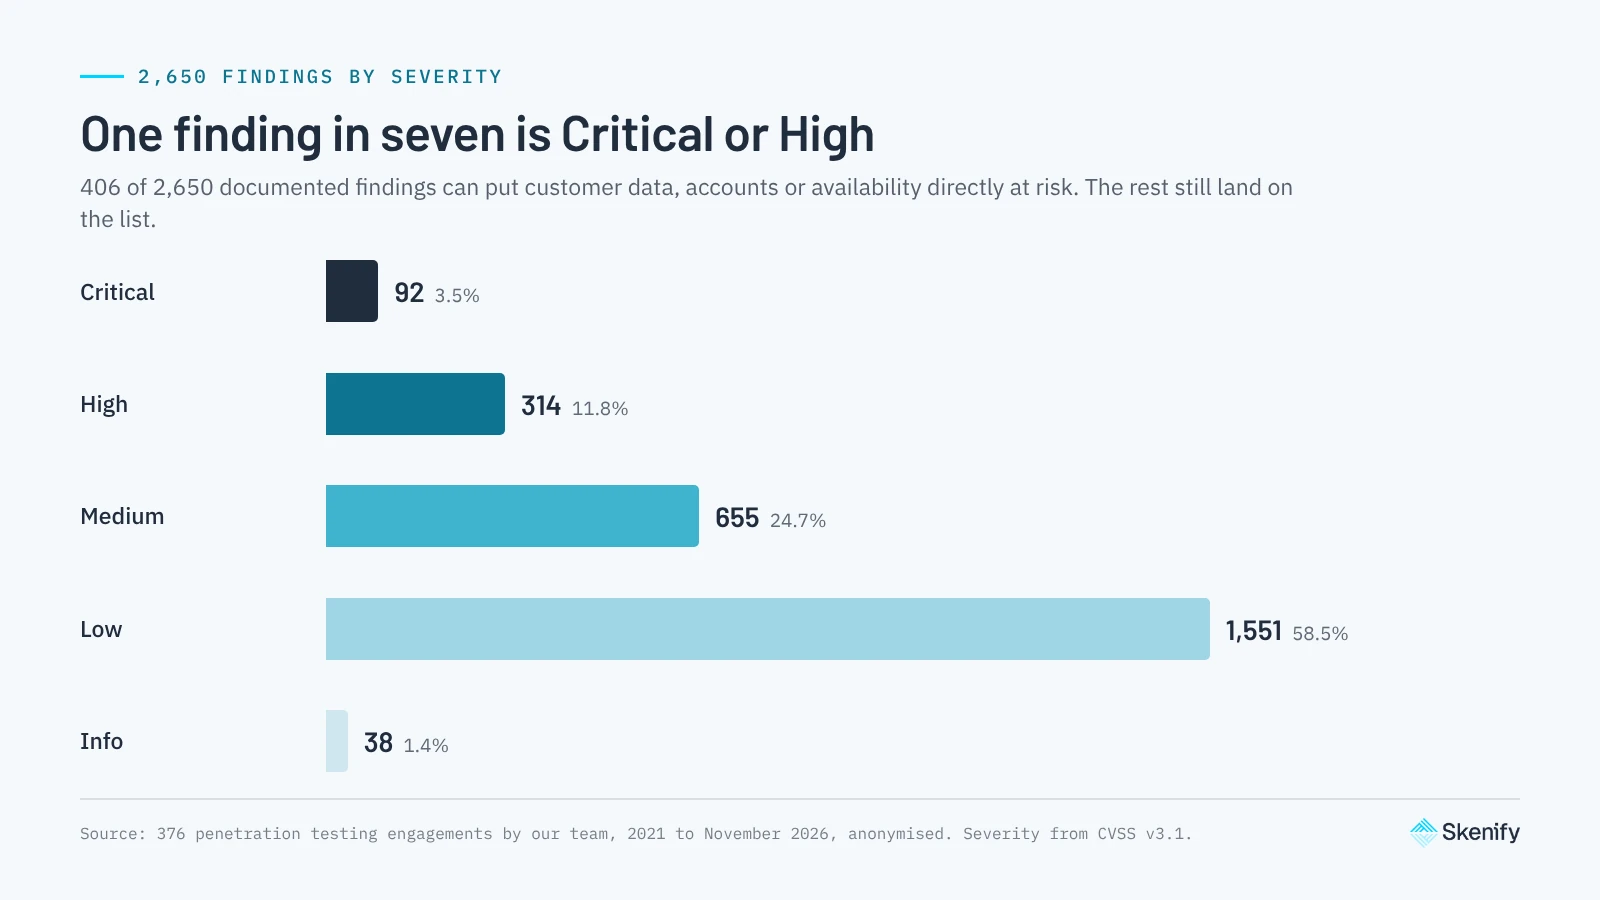
The other six findings in every seven are Medium, Low or informational, and Low alone accounts for 58.5%. They are real and they belong in a report, but they do not deserve the same day on your calendar. An average engagement produces seven findings, so a typical report contains one issue that needs action now and six that can be scheduled.
This is the pattern a small company struggles with. The report arrives as a list, every line looks technical, and nobody on the team can tell which line is the one that matters.
The most common finding is rarely the dangerous one
Security misconfiguration is the largest class in our data, with 699 findings. Only 9 of them are Critical or High, which is about 1%. Authentication and session management follows with 678 findings, of which 44 are Critical or High.
Broken access control shows the opposite picture. It has 192 findings, and 123 of them are Critical or High. That is 64%, or roughly two findings in every three.
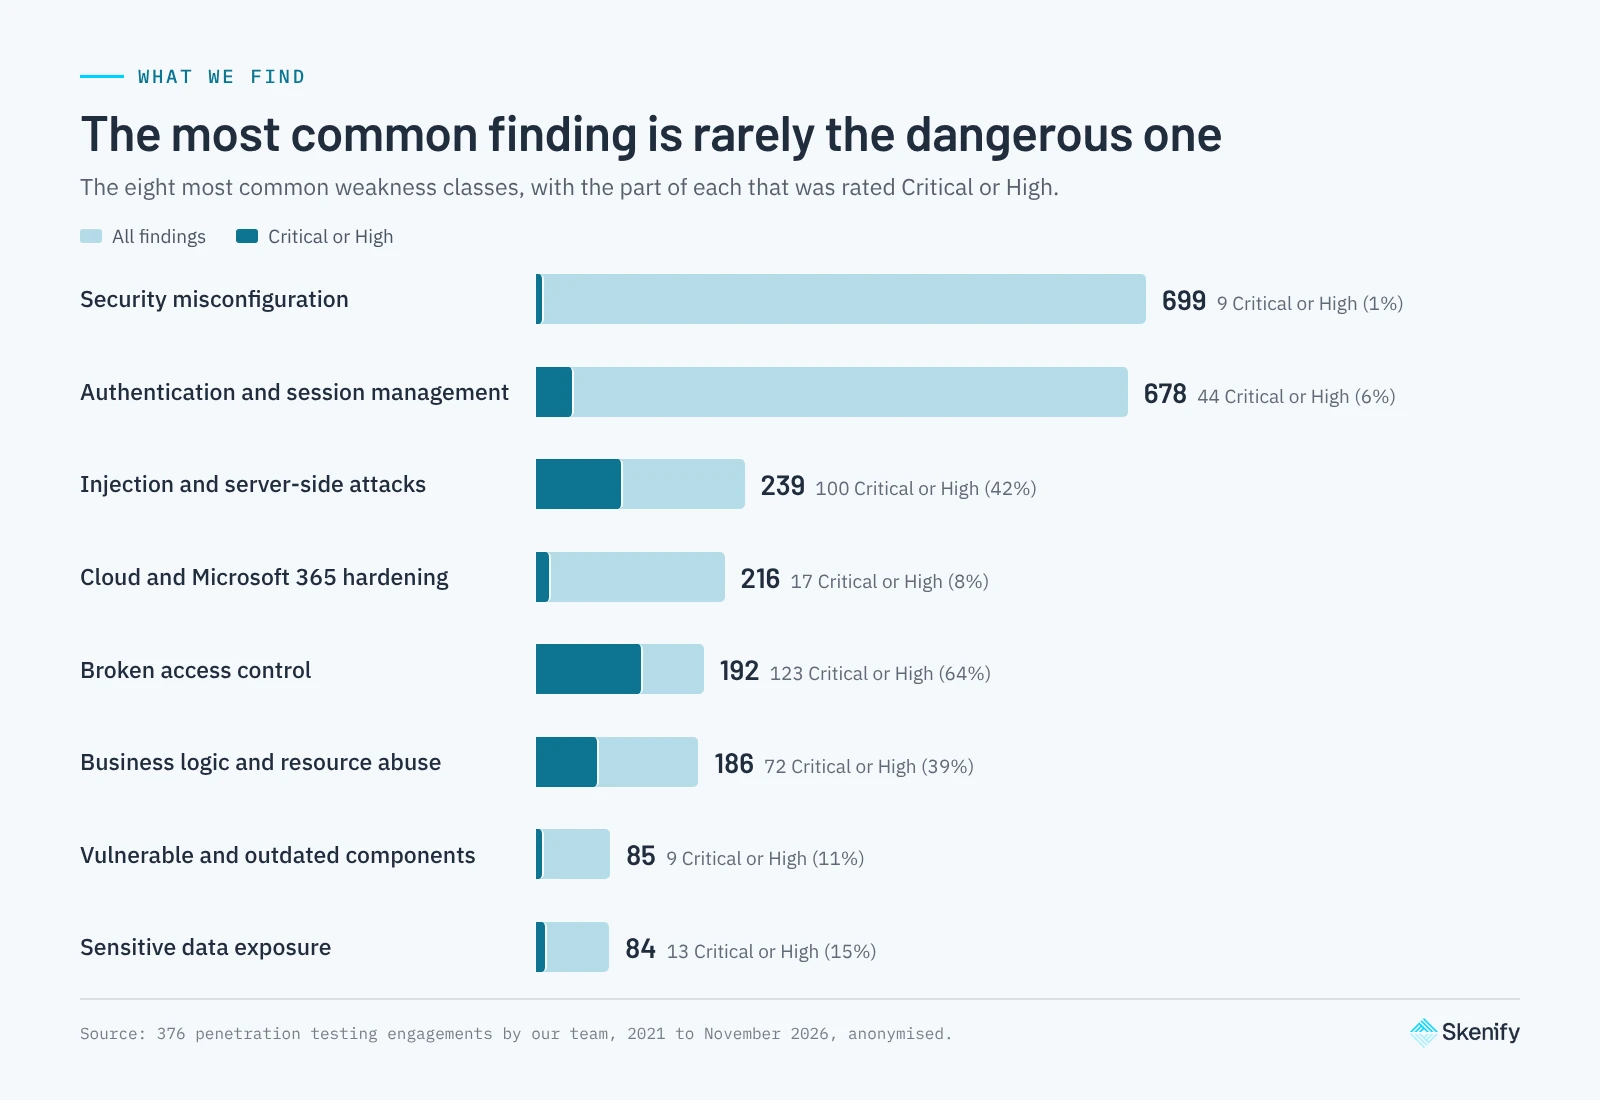
If you sorted your work by how often a problem appears, you would spend most of your time on misconfiguration and reach the dangerous findings last. Volume tells you where the noise is, and severity tells you where the risk is.
Three weakness classes hold 73% of the serious findings
- Broken access control: 123 Critical or High findings. A user reaches data or functions that belong to another user, another customer or an administrator.
- Injection and server-side attacks: 100 Critical or High findings out of 239. Input sent to the application is executed as a command or a query.
- Business logic and resource abuse: 72 Critical or High findings out of 186. The application works as coded, and the rules it follows can be turned against it.
Together these three classes account for 295 of the 406 Critical and High findings. Broken access control alone is 30% of them.
Access control and business logic findings have something in common. To confirm them, someone has to understand what a user of your application is supposed to be able to do, and then prove that they can do more. A signature cannot show that, so a tool that only matches patterns reports a possibility and leaves the proof to you.
The share of serious findings differs by sector
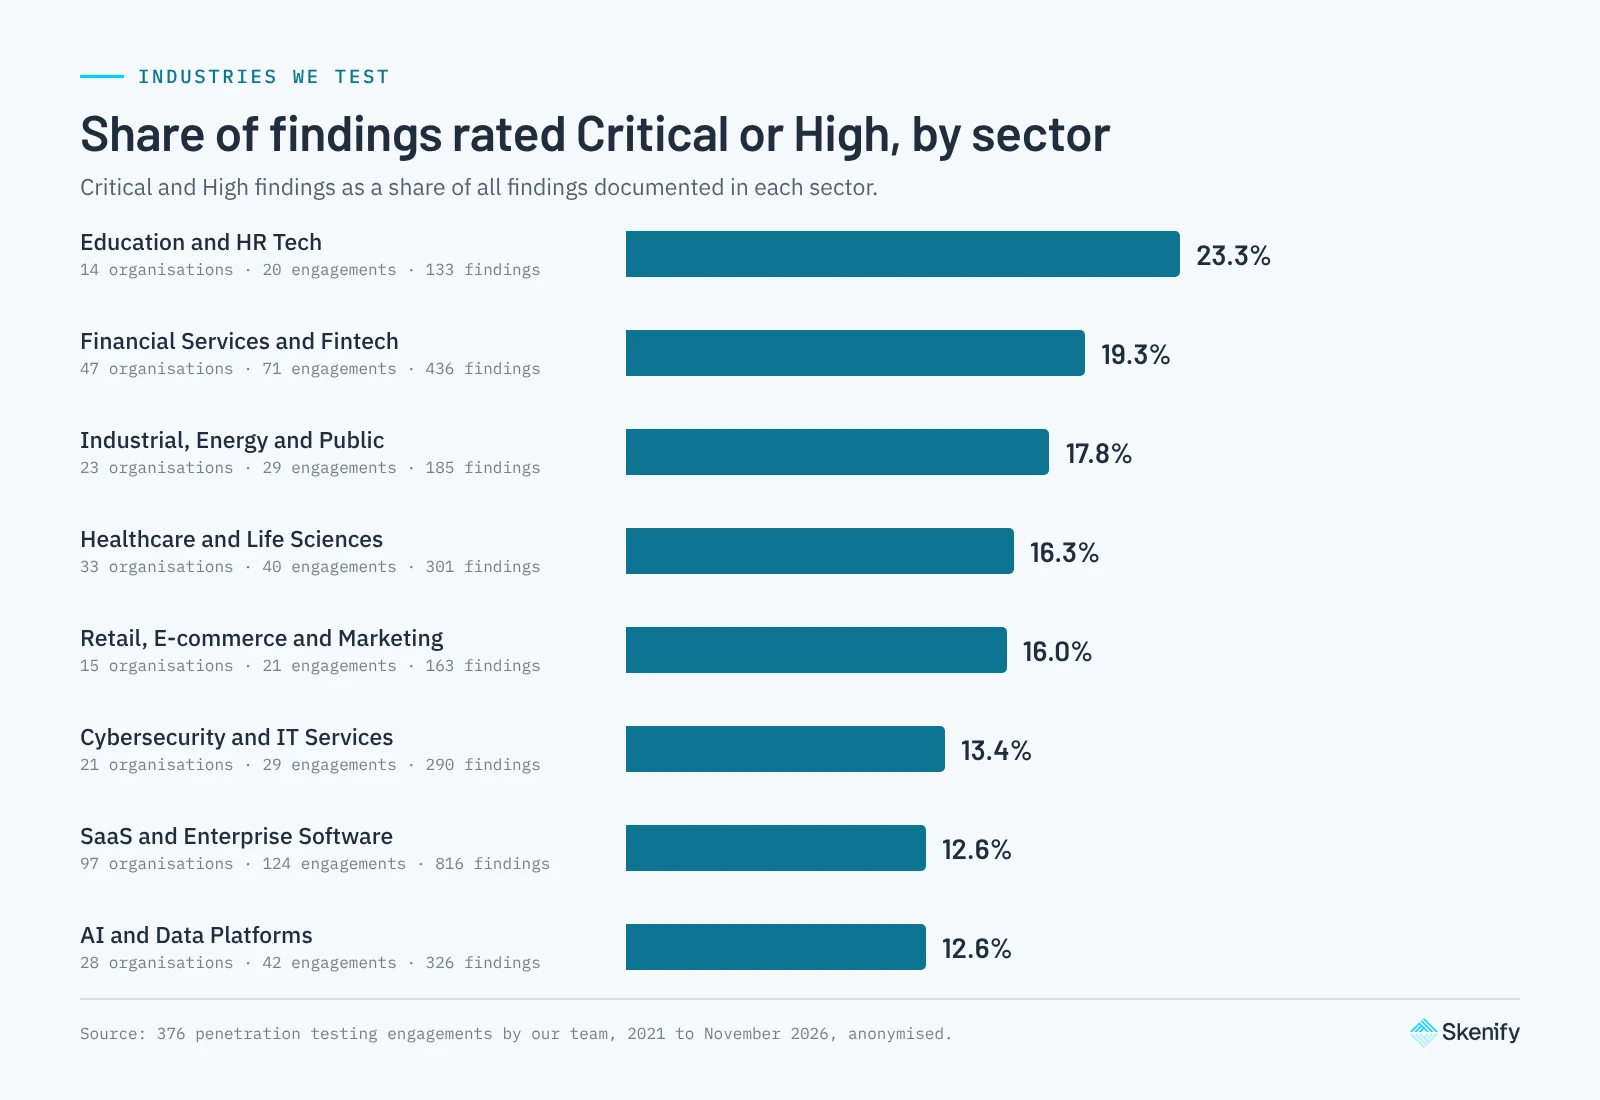
Education and HR Tech has the highest share of Critical and High findings at 23.3%, followed by Financial Services and Fintech at 19.3% and Industrial, Energy and Public at 17.8%. SaaS and Enterprise Software and AI and Data Platforms are lowest at 12.6% each.
SaaS is also our largest group, with 97 organisations, 124 engagements and 816 findings. In financial services, where 47 organisations account for 436 findings, nearly one finding in five is Critical or High.
What this means if you have no security team
- Ask for proof with every finding. A finding that comes with a working demonstration can be fixed and re-tested. A finding that says "possible" will sit in a backlog.
- Sort by severity and never by count. In our data the largest class is about 1% serious, and the fifth largest is 64% serious.
- Test what your users can reach. Check whether one customer can see the data of another, and whether an ordinary user can perform an administrator's action. Those two questions cover the class with the most Critical and High findings.
- Schedule the rest. Medium and Low findings still need an owner and a date, and they should not delay the one finding that needs action this week.
How this shaped Skenify
We built Skenify around the gap these numbers describe. Discovery is the easy part, and it produces a long list. The work that helps a company is the step after it, which is confirming what is real and putting it in order.
Every finding in Skenify is verified before it reaches your task list. AI agents attempt to exploit it and senior penetration testers confirm it, so the one in seven that matters arrives proven, with the business context and the exact fix. The rest is ranked behind it. All of it is written for all humans, not just security engineers.
About the data
The figures cover penetration testing engagements delivered by our team through The Security Company, formerly UN1QUELY, from 2021 to November 2026. All data is anonymised and aggregated. Severity follows CVSS v3.1: Critical is 9.0 and above, High is 7.0 and above, Medium is 4.0 and above, and Low is above zero. Where a CVSS score was not available, we used our internal risk score. The weakness chart shows the eight most common classes, which cover 2,379 of the 2,650 findings.
About the data
DatasetThe Security CompanyNov 2026
Anonymised penetration testing data from our team at The Security Company, 2021 to November 2026
On Skenify
See which of your findings are proven and which come first.
Request a trial